
PowerCo - EDA#
The Datasets#
ml_case_training_output.csv named as pco_output contains:
id: contact id
churned: has the client churned over the next 3 months
ml_case_training_hist_data.csv named as pco_hist contains the history of energy and power consumption per client:
id: contact id
price_date: reference date
price_p1_var: price of energy for the 1st period
price_p2_var: price of energy for the 2nd
periodprice_p3_var: price of energy for the 3rd period
price_p1_fix: price of power for the 1st period
price_p2_fix: price of power for the 2nd period
price_p3_fix: price of power for the 3rd period
ml_case_training_data.csv contains:
id: contact id
activity_new: category of the company’s activity.
campaign_disc_elec: code of the electricity campaign the customer last subscribed to.
channel_sales: code of the sales channel
cons_12m: electricity consumption of the past 12 months
cons_gas_12m: gas consumption of the past 12 months
cons_last_month: electricity consupmtion of the last month
date_activ: date of activation of the contract
date_end: registered date of the end of the contract
date_first_activ: date of first contract of the client
date_modif_prod: date of last modification of the product
date_renewal: date of the next contract renewal
forecast_base_bill_ele: forecasted electricity bill baseline for next month
forecast_base_bill_year: forecasted electricity bill baseline for calendar year
forecast_bill_12m: forecasted electricity bill baseline for 12 months
forecast_cons: forecasted electricity consumption for next month
forecast_cons_12m: forecasted electricity consumption for next 12 months
forecast_cons_year: forecasted electricity consumption for next calendar year
forecast_discount_energy: forecasted value of current discount
forecast_meter_rent_12m: forecasted bill of meter rental for the next 12 months
forecast_price_energy_p1: forecasted energy price for 1st period
forecast_price_energy_p2: forecasted energy price for 2nd period
forecast_price_pow_p1: forecasted power price for 1st period
has_gas: indicated if client is also a gas client
imp_cons: current paid consumption
margin_gross_pow_ele: gross margin on power subscription
margin_net_pow_ele: net margin on power subscription
nb_prod_act: number of active products and services
net_margin: total net margin
num_years_antig: antiquity of the client (in number of years)
origin_up: code of the electricity campaign the customer first subscribed to
pow_max: subscribed power
Import Libraries#
import pandas as pd
import numpy as np

import seaborn as sns
import matplotlib.pyplot as plt
# Show plots in jupyter notebook
%matplotlib inline

import missingno as msno
from scipy.stats import zscore as zscore

import warnings
warnings.filterwarnings("ignore")

# Set maximum number of columns to be displayed
pd.set_option('display.max_columns', 100)
Load Data#
# list of dates
dt_lst = ['date_activ','date_end','date_first_activ','date_modif_prod','date_renewal']

pco_main = pd.read_csv('data/ml_case_training_data.csv', parse_dates=dt_lst)
pco_hist = pd.read_csv('data/ml_case_training_hist_data.csv', parse_dates=['price_date'])
pco_output = pd.read_csv('data/ml_case_training_output.csv')
pd.set_option('display.max_columns',None)
Main Dataset#
pco_main.head()
| id | activity_new | campaign_disc_ele | channel_sales | cons_12m | cons_gas_12m | cons_last_month | date_activ | date_end | date_first_activ | date_modif_prod | date_renewal | forecast_base_bill_ele | forecast_base_bill_year | forecast_bill_12m | forecast_cons | forecast_cons_12m | forecast_cons_year | forecast_discount_energy | forecast_meter_rent_12m | forecast_price_energy_p1 | forecast_price_energy_p2 | forecast_price_pow_p1 | has_gas | imp_cons | margin_gross_pow_ele | margin_net_pow_ele | nb_prod_act | net_margin | num_years_antig | origin_up | pow_max | |
|---|---|---|---|---|---|---|---|---|---|---|---|---|---|---|---|---|---|---|---|---|---|---|---|---|---|---|---|---|---|---|---|---|
| 0 | 48ada52261e7cf58715202705a0451c9 | esoiiifxdlbkcsluxmfuacbdckommixw | NaN | lmkebamcaaclubfxadlmueccxoimlema | 309275 | 0 | 10025 | 2012-11-07 | 2016-11-06 | NaT | 2012-11-07 | 2015-11-09 | NaN | NaN | NaN | NaN | 26520.30 | 10025 | 0.0 | 359.29 | 0.095919 | 0.088347 | 58.995952 | f | 831.8 | -41.76 | -41.76 | 1 | 1732.36 | 3 | ldkssxwpmemidmecebumciepifcamkci | 180.000 |
| 1 | 24011ae4ebbe3035111d65fa7c15bc57 | NaN | NaN | foosdfpfkusacimwkcsosbicdxkicaua | 0 | 54946 | 0 | 2013-06-15 | 2016-06-15 | NaT | NaT | 2015-06-23 | NaN | NaN | NaN | NaN | 0.00 | 0 | 0.0 | 1.78 | 0.114481 | 0.098142 | 40.606701 | t | 0.0 | 25.44 | 25.44 | 2 | 678.99 | 3 | lxidpiddsbxsbosboudacockeimpuepw | 43.648 |
| 2 | d29c2c54acc38ff3c0614d0a653813dd | NaN | NaN | NaN | 4660 | 0 | 0 | 2009-08-21 | 2016-08-30 | NaT | 2009-08-21 | 2015-08-31 | NaN | NaN | NaN | NaN | 189.95 | 0 | 0.0 | 16.27 | 0.145711 | 0.000000 | 44.311378 | f | 0.0 | 16.38 | 16.38 | 1 | 18.89 | 6 | kamkkxfxxuwbdslkwifmmcsiusiuosws | 13.800 |
| 3 | 764c75f661154dac3a6c254cd082ea7d | NaN | NaN | foosdfpfkusacimwkcsosbicdxkicaua | 544 | 0 | 0 | 2010-04-16 | 2016-04-16 | NaT | 2010-04-16 | 2015-04-17 | NaN | NaN | NaN | NaN | 47.96 | 0 | 0.0 | 38.72 | 0.165794 | 0.087899 | 44.311378 | f | 0.0 | 28.60 | 28.60 | 1 | 6.60 | 6 | kamkkxfxxuwbdslkwifmmcsiusiuosws | 13.856 |
| 4 | bba03439a292a1e166f80264c16191cb | NaN | NaN | lmkebamcaaclubfxadlmueccxoimlema | 1584 | 0 | 0 | 2010-03-30 | 2016-03-30 | NaT | 2010-03-30 | 2015-03-31 | NaN | NaN | NaN | NaN | 240.04 | 0 | 0.0 | 19.83 | 0.146694 | 0.000000 | 44.311378 | f | 0.0 | 30.22 | 30.22 | 1 | 25.46 | 6 | kamkkxfxxuwbdslkwifmmcsiusiuosws | 13.200 |
pco_main.info()
<class 'pandas.core.frame.DataFrame'>
RangeIndex: 16096 entries, 0 to 16095
Data columns (total 32 columns):
 #   Column                    Non-Null Count  Dtype
---  ------                    --------------  -----
 0   id                        16096 non-null  object
 1   activity_new              6551 non-null   object
 2   campaign_disc_ele         0 non-null      float64
 3   channel_sales             11878 non-null  object
 4   cons_12m                  16096 non-null  int64
 5   cons_gas_12m              16096 non-null  int64
 6   cons_last_month           16096 non-null  int64
 7   date_activ                16096 non-null  datetime64[ns]
 8   date_end                  16094 non-null  datetime64[ns]
 9   date_first_activ          3508 non-null   datetime64[ns]
 10  date_modif_prod           15939 non-null  datetime64[ns]
 11  date_renewal              16056 non-null  datetime64[ns]
 12  forecast_base_bill_ele    3508 non-null   float64
 13  forecast_base_bill_year   3508 non-null   float64
 14  forecast_bill_12m         3508 non-null   float64
 15  forecast_cons             3508 non-null   float64
 16  forecast_cons_12m         16096 non-null  float64
 17  forecast_cons_year        16096 non-null  int64
 18  forecast_discount_energy  15970 non-null  float64
 19  forecast_meter_rent_12m   16096 non-null  float64
 20  forecast_price_energy_p1  15970 non-null  float64
 21  forecast_price_energy_p2  15970 non-null  float64
 22  forecast_price_pow_p1     15970 non-null  float64
 23  has_gas                   16096 non-null  object
 24  imp_cons                  16096 non-null  float64
 25  margin_gross_pow_ele      16083 non-null  float64
 26  margin_net_pow_ele        16083 non-null  float64
 27  nb_prod_act               16096 non-null  int64
 28  net_margin                16081 non-null  float64
 29  num_years_antig           16096 non-null  int64
 30  origin_up                 16009 non-null  object
 31  pow_max                   16093 non-null  float64
dtypes: datetime64[ns](5), float64(16), int64(6), object(5)
memory usage: 3.9+ MB
# Percentage of nullity by column
missing_perc = pco_main.isnull().mean() * 100
print('Percentage of Missing Values:\n', missing_perc)
Percentage of Missing Values:
 id                            0.000000
activity_new                 59.300447
campaign_disc_ele           100.000000
channel_sales                26.205268
cons_12m                      0.000000
cons_gas_12m                  0.000000
cons_last_month               0.000000
date_activ                    0.000000
date_end                      0.012425
date_first_activ             78.205765
date_modif_prod               0.975398
date_renewal                  0.248509
forecast_base_bill_ele       78.205765
forecast_base_bill_year      78.205765
forecast_bill_12m            78.205765
forecast_cons                78.205765
forecast_cons_12m             0.000000
forecast_cons_year            0.000000
forecast_discount_energy      0.782803
forecast_meter_rent_12m       0.000000
forecast_price_energy_p1      0.782803
forecast_price_energy_p2      0.782803
forecast_price_pow_p1         0.782803
has_gas                       0.000000
imp_cons                      0.000000
margin_gross_pow_ele          0.080765
margin_net_pow_ele            0.080765
nb_prod_act                   0.000000
net_margin                    0.093191
num_years_antig               0.000000
origin_up                     0.540507
pow_max                       0.018638
dtype: float64
# Descriptive statistics
pco_main.describe()
| campaign_disc_ele | cons_12m | cons_gas_12m | cons_last_month | date_activ | date_end | date_first_activ | date_modif_prod | date_renewal | forecast_base_bill_ele | forecast_base_bill_year | forecast_bill_12m | forecast_cons | forecast_cons_12m | forecast_cons_year | forecast_discount_energy | forecast_meter_rent_12m | forecast_price_energy_p1 | forecast_price_energy_p2 | forecast_price_pow_p1 | imp_cons | margin_gross_pow_ele | margin_net_pow_ele | nb_prod_act | net_margin | num_years_antig | pow_max | |
|---|---|---|---|---|---|---|---|---|---|---|---|---|---|---|---|---|---|---|---|---|---|---|---|---|---|---|---|
| count | 0.0 | 1.609600e+04 | 1.609600e+04 | 1.609600e+04 | 16096 | 16094 | 3508 | 15939 | 16056 | 3508.000000 | 3508.000000 | 3508.000000 | 3508.000000 | 16096.000000 | 16096.000000 | 15970.000000 | 16096.000000 | 15970.000000 | 15970.000000 | 15970.000000 | 16096.000000 | 16083.000000 | 16083.000000 | 16096.000000 | 16081.000000 | 16096.000000 | 16093.000000 |
| mean | NaN | 1.948044e+05 | 3.191164e+04 | 1.946154e+04 | 2011-01-17 08:58:18.011928320 | 2016-07-27 11:36:49.568783360 | 2011-06-19 20:20:23.261117440 | 2012-12-14 18:33:40.553359872 | 2015-07-20 21:56:30.134529280 | 335.843857 | 335.843857 | 3837.441866 | 206.845165 | 2370.555949 | 1907.347229 | 0.991547 | 70.309945 | 0.135901 | 0.052951 | 43.533496 | 196.123447 | 22.462276 | 21.460318 | 1.347788 | 217.987028 | 5.030629 | 20.604131 |
| min | NaN | -1.252760e+05 | -3.037000e+03 | -9.138600e+04 | 2000-07-25 00:00:00 | 2006-08-26 00:00:00 | 2001-01-10 00:00:00 | 2000-07-25 00:00:00 | 2013-06-26 00:00:00 | -364.940000 | -364.940000 | -2503.480000 | 0.000000 | -16689.260000 | -85627.000000 | 0.000000 | -242.960000 | 0.000000 | 0.000000 | -0.122184 | -9038.210000 | -525.540000 | -615.660000 | 1.000000 | -4148.990000 | 1.000000 | 1.000000 |
| 25% | NaN | 5.906250e+03 | 0.000000e+00 | 0.000000e+00 | 2010-01-12 00:00:00 | 2016-04-28 00:00:00 | 2010-08-04 18:00:00 | 2010-08-10 00:00:00 | 2015-04-19 00:00:00 | 0.000000 | 0.000000 | 1158.175000 | 0.000000 | 513.230000 | 0.000000 | 0.000000 | 16.230000 | 0.115237 | 0.000000 | 40.606701 | 0.000000 | 11.960000 | 11.950000 | 1.000000 | 51.970000 | 4.000000 | 12.500000 |
| 50% | NaN | 1.533250e+04 | 0.000000e+00 | 9.010000e+02 | 2011-03-04 00:00:00 | 2016-07-30 00:00:00 | 2011-10-28 00:00:00 | 2013-05-01 00:00:00 | 2015-07-24 00:00:00 | 162.955000 | 162.955000 | 2187.230000 | 42.215000 | 1179.160000 | 378.000000 | 0.000000 | 19.440000 | 0.142881 | 0.086163 | 44.311378 | 44.465000 | 21.090000 | 20.970000 | 1.000000 | 119.680000 | 5.000000 | 13.856000 |
| 75% | NaN | 5.022150e+04 | 0.000000e+00 | 4.127000e+03 | 2012-04-26 00:00:00 | 2016-10-31 00:00:00 | 2012-06-22 06:00:00 | 2015-05-24 00:00:00 | 2015-10-30 00:00:00 | 396.185000 | 396.185000 | 4246.555000 | 228.117500 | 2692.077500 | 1994.250000 | 0.000000 | 131.470000 | 0.146348 | 0.098837 | 44.311378 | 218.090000 | 29.640000 | 29.640000 | 1.000000 | 275.810000 | 6.000000 | 19.800000 |
| max | NaN | 1.609711e+07 | 4.188440e+06 | 4.538720e+06 | 2014-09-01 00:00:00 | 2017-06-13 00:00:00 | 2014-09-01 00:00:00 | 2016-01-29 00:00:00 | 2016-01-28 00:00:00 | 12566.080000 | 12566.080000 | 81122.630000 | 9682.890000 | 103801.930000 | 175375.000000 | 50.000000 | 2411.690000 | 0.273963 | 0.195975 | 59.444710 | 15042.790000 | 374.640000 | 374.640000 | 32.000000 | 24570.650000 | 16.000000 | 500.000000 |
| std | NaN | 6.795151e+05 | 1.775885e+05 | 8.235676e+04 | NaN | NaN | NaN | NaN | NaN | 649.406000 | 649.406000 | 5425.744327 | 455.634288 | 4035.085664 | 5257.364759 | 5.160969 | 79.023251 | 0.026252 | 0.048617 | 5.212252 | 494.366979 | 23.700883 | 27.917349 | 1.459808 | 366.742030 | 1.676101 | 21.772421 |
Observations#
14 columns have negative minimum values.
campaign_disc_elecolumn is missing completely.activity_newcolumn is missing 59.3%.The
date_first_active,forecast_base_bill_ele,forecast_base_bill_year,forecast_bill_12m, andforecast_conscolumns are each missing 78.2%.
The History Dataset#
pco_hist.head()
| id | price_date | price_p1_var | price_p2_var | price_p3_var | price_p1_fix | price_p2_fix | price_p3_fix | |
|---|---|---|---|---|---|---|---|---|
| 0 | 038af19179925da21a25619c5a24b745 | 2015-01-01 | 0.151367 | 0.0 | 0.0 | 44.266931 | 0.0 | 0.0 |
| 1 | 038af19179925da21a25619c5a24b745 | 2015-02-01 | 0.151367 | 0.0 | 0.0 | 44.266931 | 0.0 | 0.0 |
| 2 | 038af19179925da21a25619c5a24b745 | 2015-03-01 | 0.151367 | 0.0 | 0.0 | 44.266931 | 0.0 | 0.0 |
| 3 | 038af19179925da21a25619c5a24b745 | 2015-04-01 | 0.149626 | 0.0 | 0.0 | 44.266931 | 0.0 | 0.0 |
| 4 | 038af19179925da21a25619c5a24b745 | 2015-05-01 | 0.149626 | 0.0 | 0.0 | 44.266931 | 0.0 | 0.0 |
pco_hist.info()
<class 'pandas.core.frame.DataFrame'>
RangeIndex: 193002 entries, 0 to 193001
Data columns (total 8 columns):
 #   Column        Non-Null Count   Dtype
---  ------        --------------   -----
 0   id            193002 non-null  object
 1   price_date    193002 non-null  datetime64[ns]
 2   price_p1_var  191643 non-null  float64
 3   price_p2_var  191643 non-null  float64
 4   price_p3_var  191643 non-null  float64
 5   price_p1_fix  191643 non-null  float64
 6   price_p2_fix  191643 non-null  float64
 7   price_p3_fix  191643 non-null  float64
dtypes: datetime64[ns](1), float64(6), object(1)
memory usage: 11.8+ MB
# Percentage of nullity by column
missing_perc = pco_hist.isnull().mean() * 100
print('Percentage of Missing Values:\n', missing_perc)
Percentage of Missing Values:
 id              0.000000
price_date      0.000000
price_p1_var    0.704138
price_p2_var    0.704138
price_p3_var    0.704138
price_p1_fix    0.704138
price_p2_fix    0.704138
price_p3_fix    0.704138
dtype: float64
# Descriptive statistics
pco_hist.describe()
| price_date | price_p1_var | price_p2_var | price_p3_var | price_p1_fix | price_p2_fix | price_p3_fix | |
|---|---|---|---|---|---|---|---|
| count | 193002 | 191643.000000 | 191643.000000 | 191643.000000 | 191643.000000 | 191643.000000 | 191643.000000 |
| mean | 2015-06-16 12:50:49.933161216 | 0.140991 | 0.054412 | 0.030712 | 43.325546 | 10.698201 | 6.455436 |
| min | 2015-01-01 00:00:00 | 0.000000 | 0.000000 | 0.000000 | -0.177779 | -0.097752 | -0.065172 |
| 25% | 2015-04-01 00:00:00 | 0.125976 | 0.000000 | 0.000000 | 40.728885 | 0.000000 | 0.000000 |
| 50% | 2015-07-01 00:00:00 | 0.146033 | 0.085483 | 0.000000 | 44.266930 | 0.000000 | 0.000000 |
| 75% | 2015-10-01 00:00:00 | 0.151635 | 0.101780 | 0.072558 | 44.444710 | 24.339581 | 16.226389 |
| max | 2015-12-01 00:00:00 | 0.280700 | 0.229788 | 0.114102 | 59.444710 | 36.490692 | 17.458221 |
| std | NaN | 0.025117 | 0.050033 | 0.036335 | 5.437952 | 12.856046 | 7.782279 |
Observations#
price_p1_var,price_p2_var,price_p3_var,price_p1_fix,price_p2_fix,price_p3_fixare missing 70.4% values.price_p1_fix,price_p2_fix,price_p3_fixcontain negative values, which doesn’t make sense for price of power.
The Output Dataset#
pco_output.head()
| id | churn | |
|---|---|---|
| 0 | 48ada52261e7cf58715202705a0451c9 | 0 |
| 1 | 24011ae4ebbe3035111d65fa7c15bc57 | 1 |
| 2 | d29c2c54acc38ff3c0614d0a653813dd | 0 |
| 3 | 764c75f661154dac3a6c254cd082ea7d | 0 |
| 4 | bba03439a292a1e166f80264c16191cb | 0 |
pco_output.info()
<class 'pandas.core.frame.DataFrame'>
RangeIndex: 16096 entries, 0 to 16095
Data columns (total 2 columns):
 #   Column  Non-Null Count  Dtype
---  ------  --------------  -----
 0   id      16096 non-null  object
 1   churn   16096 non-null  int64
dtypes: int64(1), object(1)
memory usage: 251.6+ KB
# Percentage of nullity by column
missing_perc = pco_output.isnull().mean() * 100
print('Percentage of Missing Values:\n', missing_perc)
Percentage of Missing Values:
 id       0.0
churn    0.0
dtype: float64
# Descriptive statistics
pco_output.describe()
| churn | |
|---|---|
| count | 16096.000000 |
| mean | 0.099093 |
| std | 0.298796 |
| min | 0.000000 |
| 25% | 0.000000 |
| 50% | 0.000000 |
| 75% | 0.000000 |
| max | 1.000000 |
Observations#
Complete dataset.
Data Cleaning and Imputation#
Missing Data#
Types of missingness#
Missing Completely at Random (MCAR)
Missingness has no relationship between any values, observed or missing
Missing at Random (MAR)
There is a systematic relationship between missingness and other observed data, but not the missing data
Missing Not at Random (MNAR)
There is a relationship between missingness and its values, missing or non-missing
The History Dataset#
# Identify negative columns
negative_cols = ['price_p1_fix','price_p2_fix','price_p3_fix']
# Convert to positive the negative columns in pco_hist
pco_hist[negative_cols] = pco_hist[negative_cols].apply(abs)

pco_hist.describe()
| price_date | price_p1_var | price_p2_var | price_p3_var | price_p1_fix | price_p2_fix | price_p3_fix | |
|---|---|---|---|---|---|---|---|
| count | 193002 | 191643.000000 | 191643.000000 | 191643.000000 | 191643.000000 | 191643.000000 | 191643.000000 |
| mean | 2015-06-16 12:50:49.933161216 | 0.140991 | 0.054412 | 0.030712 | 43.325563 | 10.698210 | 6.455443 |
| min | 2015-01-01 00:00:00 | 0.000000 | 0.000000 | 0.000000 | 0.000000 | 0.000000 | 0.000000 |
| 25% | 2015-04-01 00:00:00 | 0.125976 | 0.000000 | 0.000000 | 40.728885 | 0.000000 | 0.000000 |
| 50% | 2015-07-01 00:00:00 | 0.146033 | 0.085483 | 0.000000 | 44.266930 | 0.000000 | 0.000000 |
| 75% | 2015-10-01 00:00:00 | 0.151635 | 0.101780 | 0.072558 | 44.444710 | 24.339581 | 16.226389 |
| max | 2015-12-01 00:00:00 | 0.280700 | 0.229788 | 0.114102 | 59.444710 | 36.490692 | 17.458221 |
| std | NaN | 0.025117 | 0.050033 | 0.036335 | 5.437816 | 12.856039 | 7.782273 |
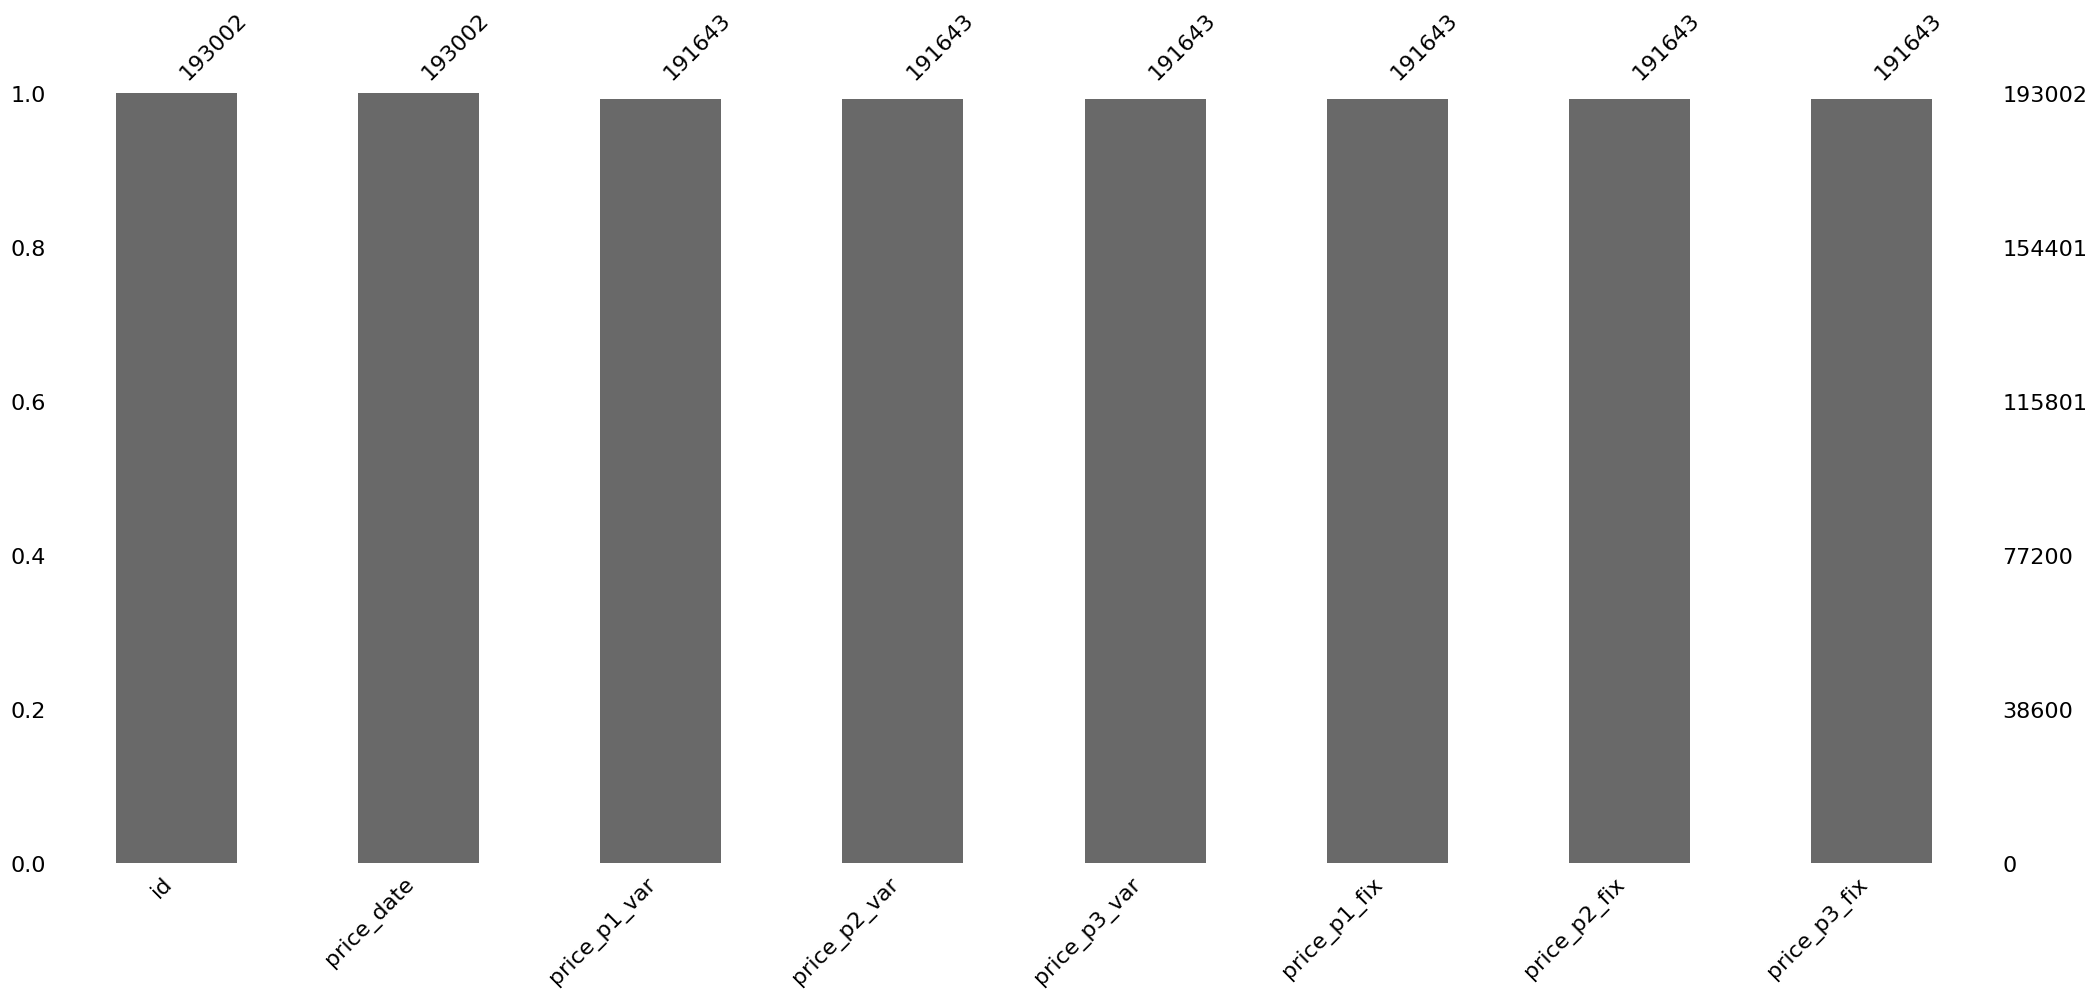
# Visualize the completeness of the dataframe
msno.bar(pco_hist)
plt.show()
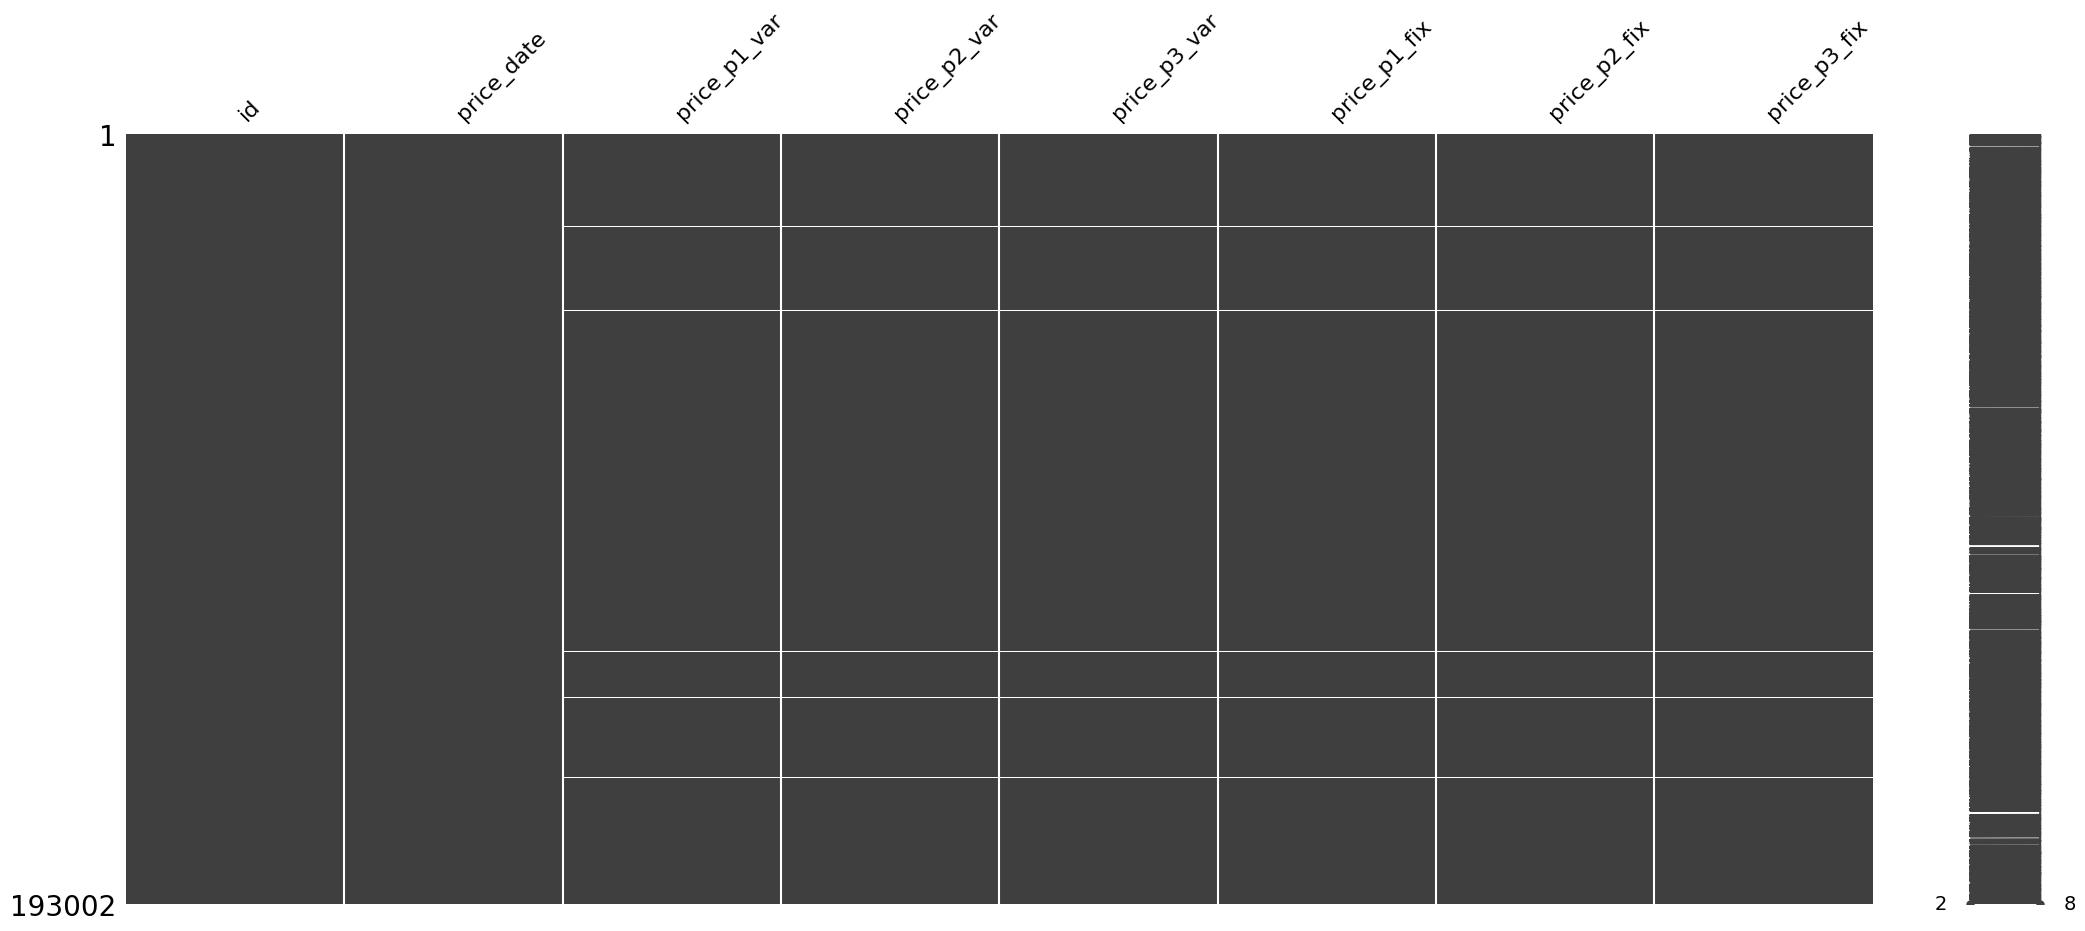
# Visualize the locations of the missing values of the dataset
sorted = pco_hist.sort_values(by = ['id','price_date'])
msno.matrix(sorted)
plt.show()
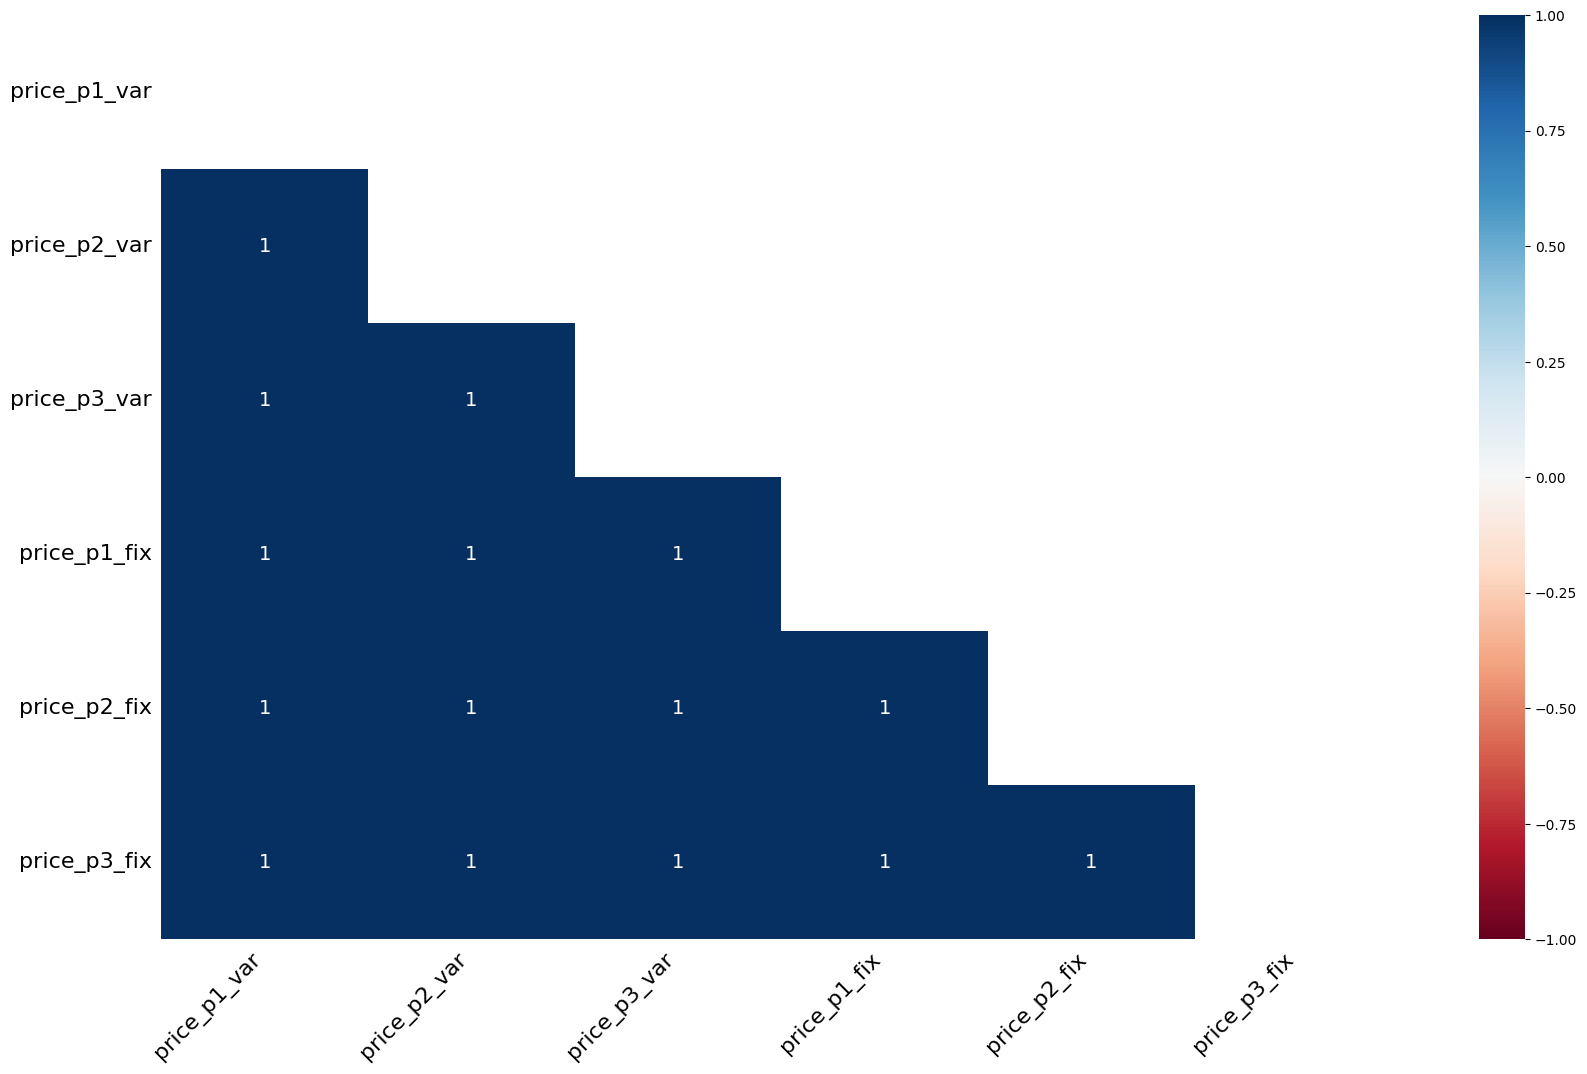
# Visualize the correlation between the numeric variables of the dataframe
msno.heatmap(pco_hist)
plt.show()
# Identify the index of the IDs containing missing values.
hist_NAN_index = pco_hist[pco_hist.isnull().any(axis=1)].index.values.tolist()

# Obtain a dataframe with the missing values
pco_hist_missing = pco_hist.iloc[hist_NAN_index,:]

# Glimpse at the NaN cases of the pco_hist dataset
pco_hist_missing.head(10)
| id | price_date | price_p1_var | price_p2_var | price_p3_var | price_p1_fix | price_p2_fix | price_p3_fix | |
|---|---|---|---|---|---|---|---|---|
| 75 | ef716222bbd97a8bdfcbb831e3575560 | 2015-04-01 | NaN | NaN | NaN | NaN | NaN | NaN |
| 221 | 0f5231100b2febab862f8dd8eaab3f43 | 2015-06-01 | NaN | NaN | NaN | NaN | NaN | NaN |
| 377 | 2f93639de582fadfbe3e86ce1c8d8f35 | 2015-06-01 | NaN | NaN | NaN | NaN | NaN | NaN |
| 413 | f83c1ab1ca1d1802bb1df4d72820243c | 2015-06-01 | NaN | NaN | NaN | NaN | NaN | NaN |
| 461 | 3076c6d4a060e12a049d1700d9b09cf3 | 2015-06-01 | NaN | NaN | NaN | NaN | NaN | NaN |
| 471 | 33bb3af90650ac2e9ecac6ff2c975a6b | 2015-04-01 | NaN | NaN | NaN | NaN | NaN | NaN |
| 472 | 33bb3af90650ac2e9ecac6ff2c975a6b | 2015-05-01 | NaN | NaN | NaN | NaN | NaN | NaN |
| 475 | 33bb3af90650ac2e9ecac6ff2c975a6b | 2015-08-01 | NaN | NaN | NaN | NaN | NaN | NaN |
| 476 | 33bb3af90650ac2e9ecac6ff2c975a6b | 2015-09-01 | NaN | NaN | NaN | NaN | NaN | NaN |
| 874 | 0e90101b08183cc9548e827e4b256f47 | 2015-12-01 | NaN | NaN | NaN | NaN | NaN | NaN |
# extract the unique dates of missing data
date_lst = pco_hist_missing['price_date'].unique()
id_lst = pco_hist_missing['id'].unique()

# Create a time dataframe with the unique dates
time_df = pd.DataFrame(data=date_lst, columns=['price_date'] )

# Glimpse the time dataframe
time_df.sort_values(by=['price_date'])
| price_date | |
|---|---|
| 9 | 2015-01-01 |
| 11 | 2015-02-01 |
| 8 | 2015-03-01 |
| 0 | 2015-04-01 |
| 2 | 2015-05-01 |
| 1 | 2015-06-01 |
| 10 | 2015-07-01 |
| 3 | 2015-08-01 |
| 4 | 2015-09-01 |
| 7 | 2015-10-01 |
| 6 | 2015-11-01 |
| 5 | 2015-12-01 |
Observations#
The columns containing prices display strong positive correlation in the missingness, suggesting a case of MNAR.
We can use trend and cyclicality when imputing time series data.
# Make a copy of pco_hist dataset
pco_hist_ff = pco_hist.copy(deep=True)

# Print prior to imputing missing values
print(pco_hist_ff.iloc[hist_NAN_index,3:9].head())

# Fill NaNs using forward fill
pco_hist_ff.fillna(method = 'ffill', inplace=True)

print(pco_hist_ff.iloc[hist_NAN_index,3:9].head())
     price_p2_var  price_p3_var  price_p1_fix  price_p2_fix  price_p3_fix
75            NaN           NaN           NaN           NaN           NaN
221           NaN           NaN           NaN           NaN           NaN
377           NaN           NaN           NaN           NaN           NaN
413           NaN           NaN           NaN           NaN           NaN
461           NaN           NaN           NaN           NaN           NaN
     price_p2_var  price_p3_var  price_p1_fix  price_p2_fix  price_p3_fix
75       0.000000      0.000000     44.266931      0.000000      0.000000
221      0.000000      0.000000     44.266931      0.000000      0.000000
377      0.087970      0.000000     44.266931      0.000000      0.000000
413      0.102239      0.070381     40.565969     24.339581     16.226389
461      0.000000      0.000000     44.266931      0.000000      0.000000
# Merge output dataset with historical forward fill dataset
pco_hist_ff_merged = pco_hist_ff.merge(right=pco_output,on=['id'])
pco_hist_ff_merged.head()
| id | price_date | price_p1_var | price_p2_var | price_p3_var | price_p1_fix | price_p2_fix | price_p3_fix | churn | |
|---|---|---|---|---|---|---|---|---|---|
| 0 | 038af19179925da21a25619c5a24b745 | 2015-01-01 | 0.151367 | 0.0 | 0.0 | 44.266931 | 0.0 | 0.0 | 0 |
| 1 | 038af19179925da21a25619c5a24b745 | 2015-02-01 | 0.151367 | 0.0 | 0.0 | 44.266931 | 0.0 | 0.0 | 0 |
| 2 | 038af19179925da21a25619c5a24b745 | 2015-03-01 | 0.151367 | 0.0 | 0.0 | 44.266931 | 0.0 | 0.0 | 0 |
| 3 | 038af19179925da21a25619c5a24b745 | 2015-04-01 | 0.149626 | 0.0 | 0.0 | 44.266931 | 0.0 | 0.0 | 0 |
| 4 | 038af19179925da21a25619c5a24b745 | 2015-05-01 | 0.149626 | 0.0 | 0.0 | 44.266931 | 0.0 | 0.0 | 0 |
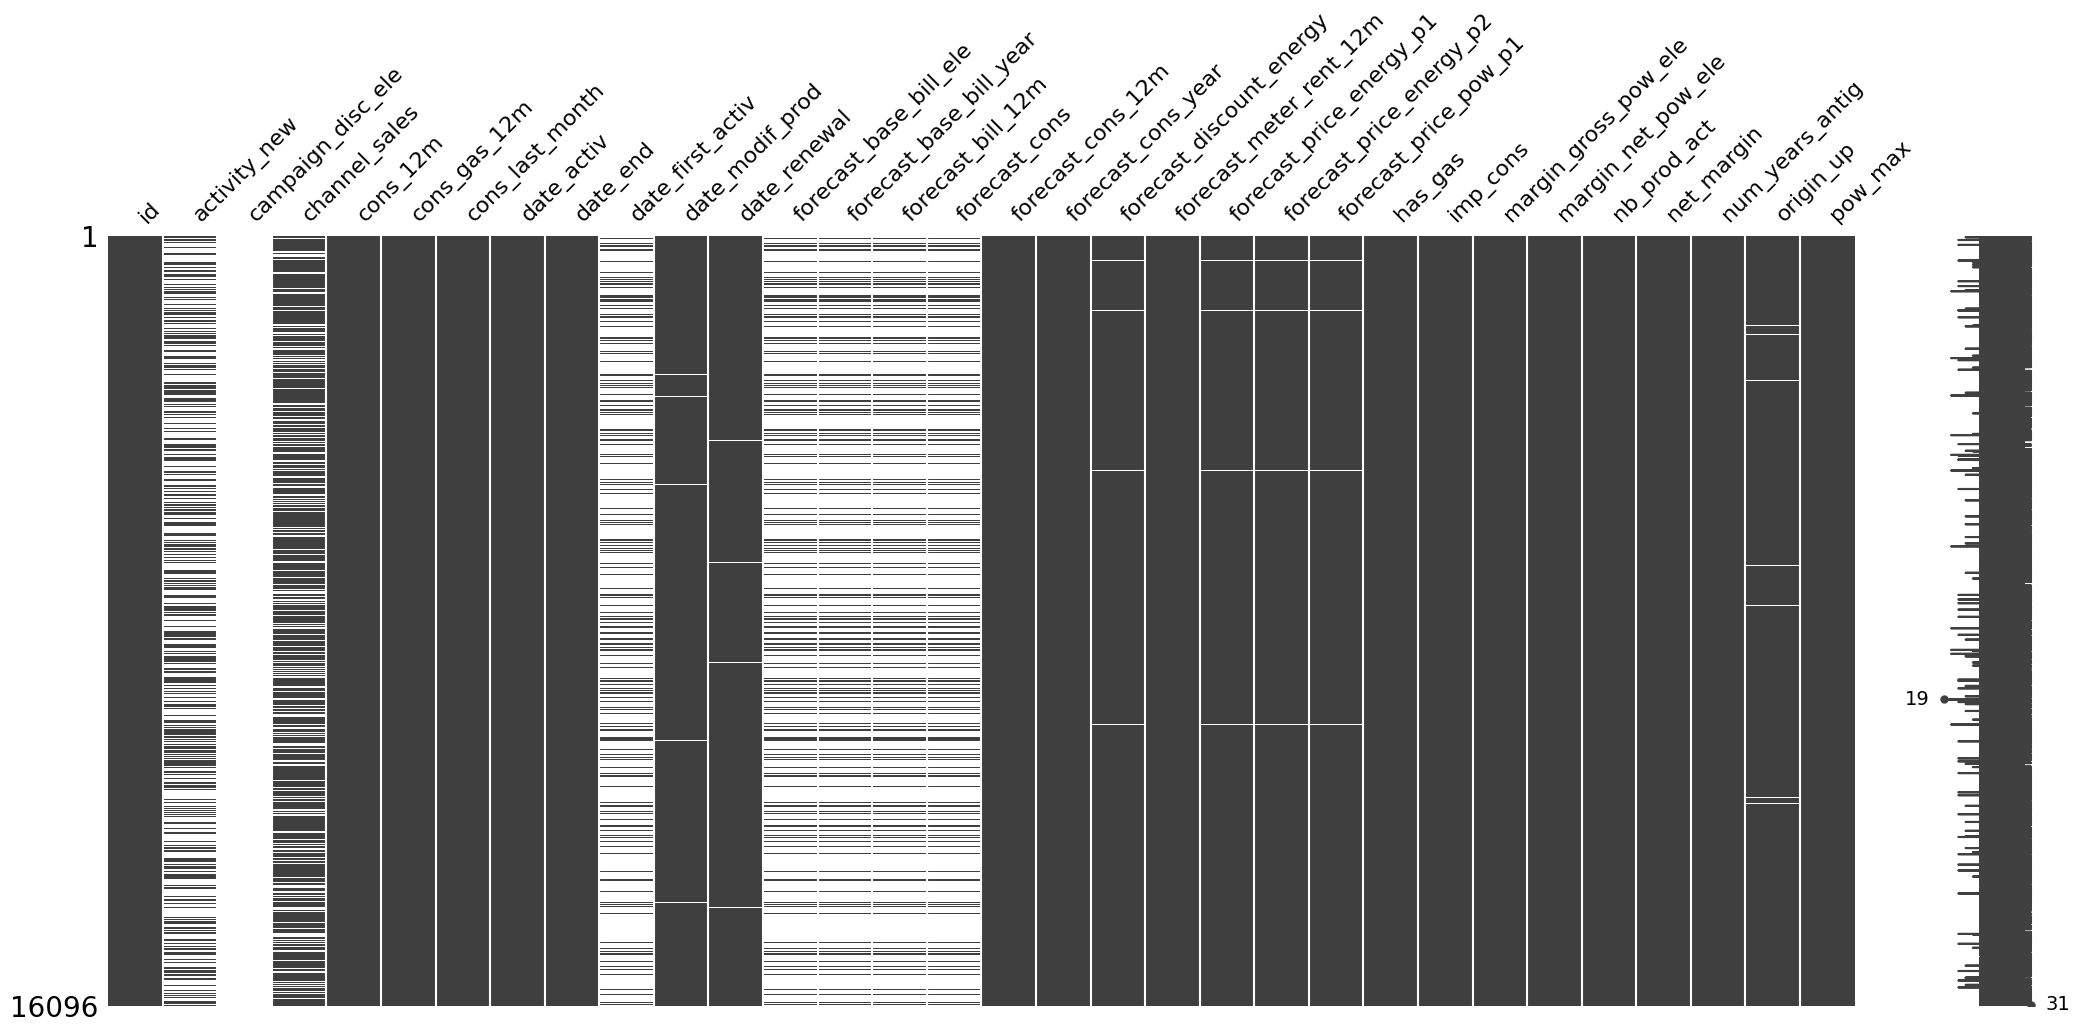
The Main Dataset#
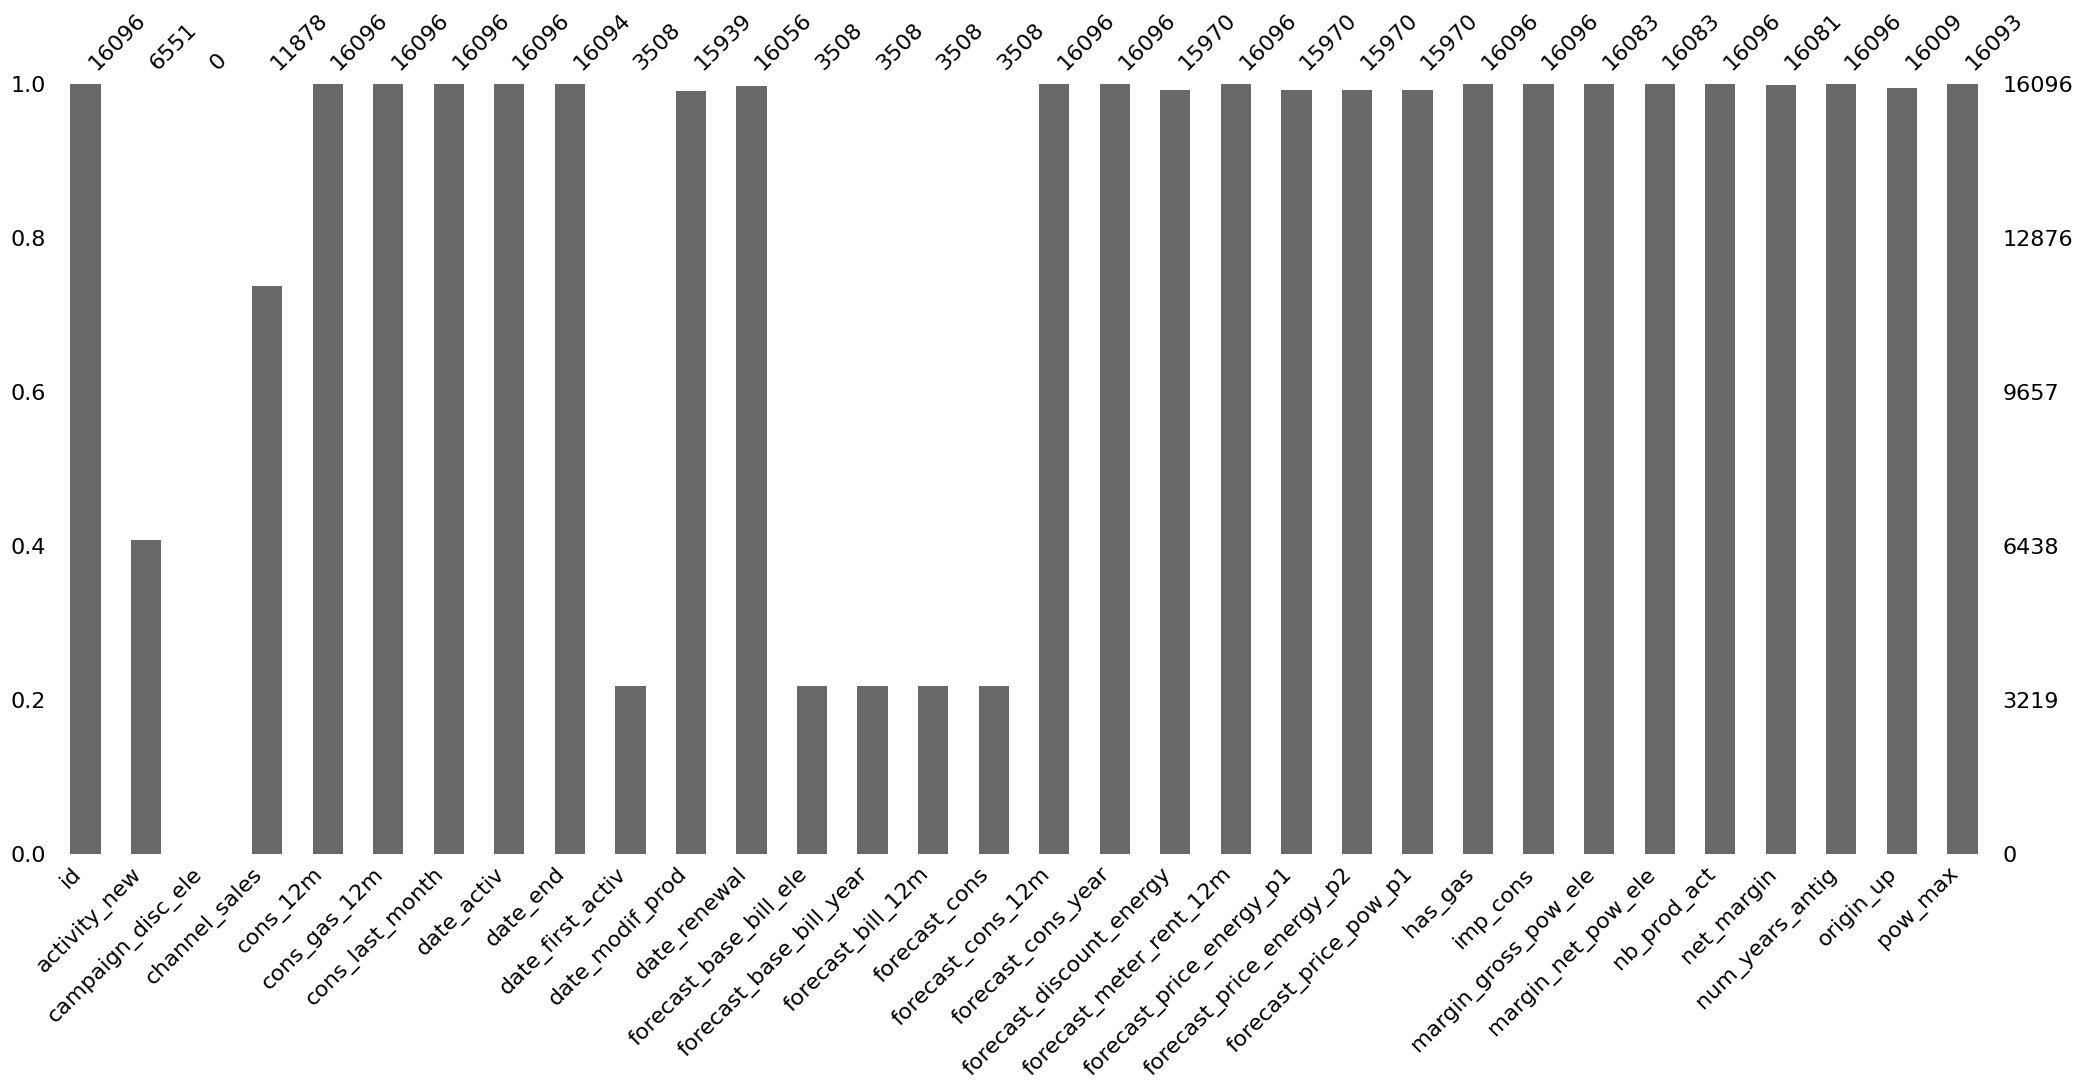
# Visualize the completeness of the dataframe
msno.bar(pco_main)
plt.show()
# Visualize the locations of the missing values of the dataset
msno.matrix(pco_main)
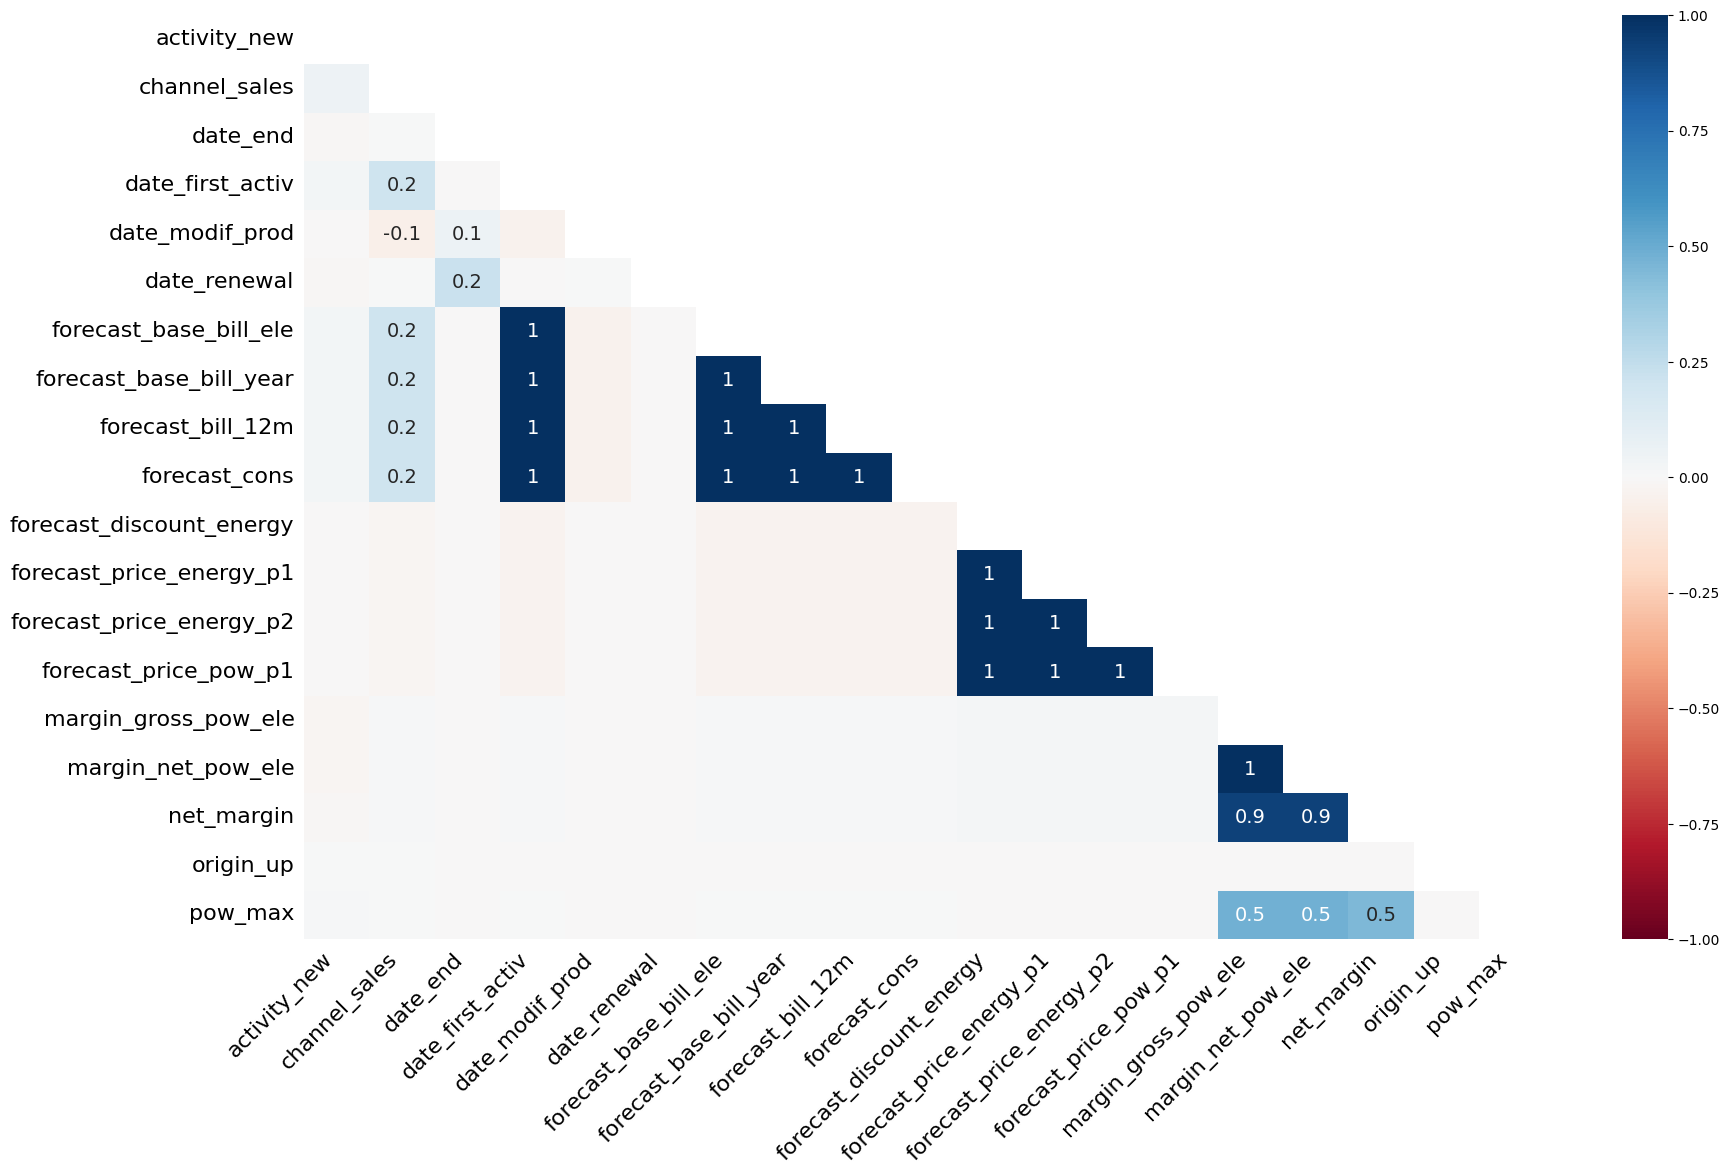
plt.show()
msno.heatmap(pco_main)
plt.show()
# Demonstrate why the date_activ column cannot replace completely date_first_activ
activity = ['date_activ','date_first_activ']

# Filter the columns of interest
pco_activity = pco_main[activity]

# Obtain only the complete cases
pco_activity_cc = pco_activity.dropna(subset=['date_first_activ'],how='any',inplace=False)

# Test whether two objects contain the same elements.
pco_activity_cc.date_activ.equals(pco_activity_cc.date_first_activ)

# Describe it
pco_activity_cc.describe()
| date_activ | date_first_activ | |
|---|---|---|
| count | 3508 | 3508 |
| mean | 2011-09-03 07:45:05.131128832 | 2011-06-19 20:20:23.261117440 |
| min | 2003-09-23 00:00:00 | 2001-01-10 00:00:00 |
| 25% | 2010-10-26 00:00:00 | 2010-08-04 18:00:00 |
| 50% | 2012-01-03 00:00:00 | 2011-10-28 00:00:00 |
| 75% | 2012-08-08 00:00:00 | 2012-06-22 06:00:00 |
| max | 2014-09-01 00:00:00 | 2014-09-01 00:00:00 |
# Drop the column activity_new and campaign_disc_elec
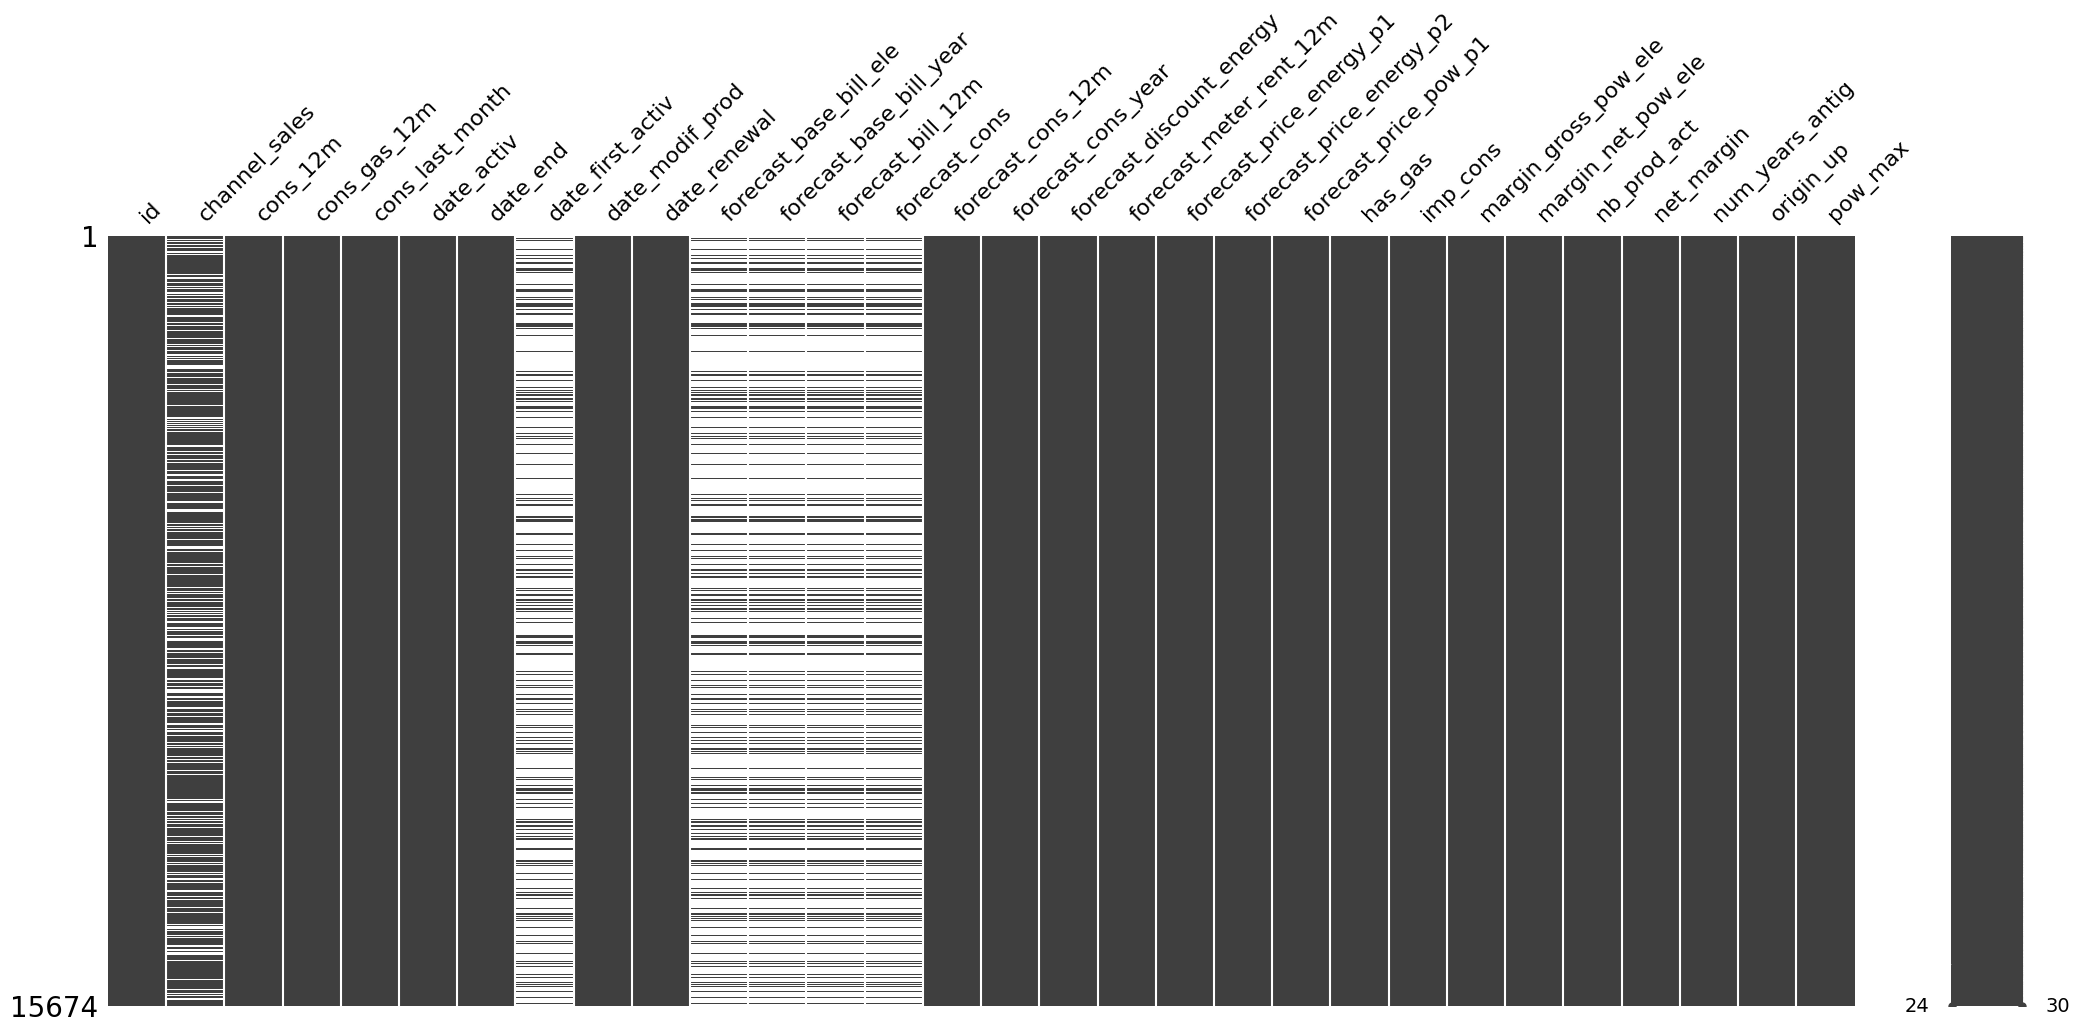
pco_main_drop = pco_main.drop(labels= ['activity_new','campaign_disc_ele'] , axis=1)
# Remove date_end date_modif_prod date_renewal origin_up pow_max margin_gross_pow_ele margin_net_pow_ele net_margin
brush = ['date_end','date_modif_prod','date_renewal','origin_up','pow_max','margin_gross_pow_ele',
'margin_net_pow_ele', 'net_margin','forecast_discount_energy','forecast_price_energy_p1',
'forecast_price_energy_p2','forecast_price_pow_p1']
pco_main_drop.dropna(subset=brush, how='any',inplace=True)
msno.matrix(pco_main_drop)
plt.show()
Observations#
activity_newis MCAR with low correlation with other variables. Can drop this columncampaign_disc_elecis MCAR. Can drop this column. Suggests that subscribers are not subscribing through campaign offers.date_first_activcannot replacedate_active. MARnet_marginhas strong correlation betweenmargin_gross_pow_elecandmargin)_net_pow_ele. Suggests multi-colinearity.origin_upandpow_maxis MCAR. Can drop.Forecast_base_bill_ele,forecast_base_bill_year,forecast_bill_12mandforecast_cons variablesare highly correlated withdate_first_activ. MNAR
# Choose the columns without missing values
incomplete_cols = ['channel_sales','date_first_activ','forecast_base_bill_ele','forecast_base_bill_year','forecast_bill_12m','forecast_cons']

complete_cols = [column_name for column_name in pco_main_drop.columns if column_name not in incomplete_cols]

pco_main_cc = pco_main_drop[complete_cols]

# Fix negative numeric variables
numeric = [column_name for column_name in pco_main_cc.columns
           if pco_main_cc[column_name].dtype == 'float64'
           or pco_main_cc[column_name].dtype == 'int64']

# Overwrite positive values on negative values
pco_main_cc[numeric] = pco_main_cc[numeric].apply(abs)

# Describe
pco_main_cc.describe()
| cons_12m | cons_gas_12m | cons_last_month | date_activ | date_end | date_modif_prod | date_renewal | forecast_cons_12m | forecast_cons_year | forecast_discount_energy | forecast_meter_rent_12m | forecast_price_energy_p1 | forecast_price_energy_p2 | forecast_price_pow_p1 | imp_cons | margin_gross_pow_ele | margin_net_pow_ele | nb_prod_act | net_margin | num_years_antig | pow_max | |
|---|---|---|---|---|---|---|---|---|---|---|---|---|---|---|---|---|---|---|---|---|---|
| count | 1.567400e+04 | 1.567400e+04 | 1.567400e+04 | 15674 | 15674 | 15674 | 15674 | 15674.000000 | 15674.000000 | 15674.000000 | 15674.000000 | 15674.000000 | 15674.000000 | 15674.000000 | 15674.000000 | 15674.000000 | 15674.000000 | 15674.000000 | 15674.000000 | 15674.000000 | 15674.000000 |
| mean | 1.916143e+05 | 3.132400e+04 | 1.941588e+04 | 2011-01-08 05:05:17.417379328 | 2016-07-28 01:39:57.396962816 | 2012-12-09 11:44:28.419037952 | 2015-07-21 02:51:14.952150016 | 2359.676441 | 1911.698354 | 0.976139 | 70.210965 | 0.135925 | 0.052858 | 43.522191 | 196.641669 | 23.556272 | 24.125235 | 1.348092 | 221.259158 | 5.052188 | 20.438270 |
| min | 0.000000e+00 | 0.000000e+00 | 0.000000e+00 | 2000-07-25 00:00:00 | 2013-05-06 00:00:00 | 2000-07-25 00:00:00 | 2013-06-26 00:00:00 | 0.000000 | 0.000000 | 0.000000 | 0.000000 | 0.000000 | 0.000000 | 0.000000 | 0.000000 | 0.000000 | 0.000000 | 1.000000 | 0.000000 | 1.000000 | 1.000000 |
| 25% | 5.893250e+03 | 0.000000e+00 | 0.000000e+00 | 2010-01-11 00:00:00 | 2016-04-27 00:00:00 | 2010-08-04 00:00:00 | 2015-04-17 00:00:00 | 514.045000 | 0.000000 | 0.000000 | 16.230000 | 0.115237 | 0.000000 | 40.606701 | 0.000000 | 12.360000 | 12.360000 | 1.000000 | 52.802500 | 4.000000 | 12.500000 |
| 50% | 1.522000e+04 | 0.000000e+00 | 9.090000e+02 | 2011-02-21 00:00:00 | 2016-08-01 00:00:00 | 2013-04-22 00:00:00 | 2015-07-27 00:00:00 | 1178.970000 | 382.000000 | 0.000000 | 19.430000 | 0.142881 | 0.086163 | 44.311378 | 44.870000 | 21.090000 | 21.090000 | 1.000000 | 120.545000 | 5.000000 | 13.856000 |
| 75% | 4.953825e+04 | 0.000000e+00 | 4.131500e+03 | 2012-04-17 00:00:00 | 2016-11-01 00:00:00 | 2015-05-24 00:00:00 | 2015-10-30 00:00:00 | 2677.220000 | 1994.750000 | 0.000000 | 131.500000 | 0.146348 | 0.098837 | 44.311378 | 217.962500 | 29.640000 | 29.760000 | 1.000000 | 275.797500 | 6.000000 | 19.800000 |
| max | 1.609711e+07 | 4.154590e+06 | 4.538720e+06 | 2014-09-01 00:00:00 | 2017-06-13 00:00:00 | 2016-01-29 00:00:00 | 2016-01-28 00:00:00 | 103801.930000 | 175375.000000 | 50.000000 | 2411.690000 | 0.273963 | 0.195975 | 59.444710 | 15042.790000 | 525.540000 | 615.660000 | 32.000000 | 24570.650000 | 16.000000 | 500.000000 |
| std | 6.724688e+05 | 1.716291e+05 | 8.226881e+04 | NaN | NaN | NaN | NaN | 3979.605687 | 5224.813531 | 5.124103 | 78.560454 | 0.026282 | 0.048638 | 5.221651 | 490.956048 | 22.456277 | 25.599218 | 1.475092 | 362.053657 | 1.670284 | 21.164053 |
# Convert the has_gas column to  Yes/No
pco_main_cc['has_gas'] = pco_main_cc['has_gas'].replace({'t':'Yes','f':'No'})

# Merge the main dataset with the output dataset
pco_main_cc_merged = pco_main_cc.merge(right=pco_output,on=['id'])

# Convert the churn column to Churned/Stayed
pco_main_cc_merged['churn'] = pco_main_cc_merged['churn'].replace({1:'Churned',0:'Stayed'})
pco_main_cc_merged.head()
| id | cons_12m | cons_gas_12m | cons_last_month | date_activ | date_end | date_modif_prod | date_renewal | forecast_cons_12m | forecast_cons_year | forecast_discount_energy | forecast_meter_rent_12m | forecast_price_energy_p1 | forecast_price_energy_p2 | forecast_price_pow_p1 | has_gas | imp_cons | margin_gross_pow_ele | margin_net_pow_ele | nb_prod_act | net_margin | num_years_antig | origin_up | pow_max | churn | |
|---|---|---|---|---|---|---|---|---|---|---|---|---|---|---|---|---|---|---|---|---|---|---|---|---|---|
| 0 | 48ada52261e7cf58715202705a0451c9 | 309275 | 0 | 10025 | 2012-11-07 | 2016-11-06 | 2012-11-07 | 2015-11-09 | 26520.30 | 10025 | 0.0 | 359.29 | 0.095919 | 0.088347 | 58.995952 | No | 831.80 | 41.76 | 41.76 | 1 | 1732.36 | 3 | ldkssxwpmemidmecebumciepifcamkci | 180.000 | Stayed |
| 1 | d29c2c54acc38ff3c0614d0a653813dd | 4660 | 0 | 0 | 2009-08-21 | 2016-08-30 | 2009-08-21 | 2015-08-31 | 189.95 | 0 | 0.0 | 16.27 | 0.145711 | 0.000000 | 44.311378 | No | 0.00 | 16.38 | 16.38 | 1 | 18.89 | 6 | kamkkxfxxuwbdslkwifmmcsiusiuosws | 13.800 | Stayed |
| 2 | 764c75f661154dac3a6c254cd082ea7d | 544 | 0 | 0 | 2010-04-16 | 2016-04-16 | 2010-04-16 | 2015-04-17 | 47.96 | 0 | 0.0 | 38.72 | 0.165794 | 0.087899 | 44.311378 | No | 0.00 | 28.60 | 28.60 | 1 | 6.60 | 6 | kamkkxfxxuwbdslkwifmmcsiusiuosws | 13.856 | Stayed |
| 3 | bba03439a292a1e166f80264c16191cb | 1584 | 0 | 0 | 2010-03-30 | 2016-03-30 | 2010-03-30 | 2015-03-31 | 240.04 | 0 | 0.0 | 19.83 | 0.146694 | 0.000000 | 44.311378 | No | 0.00 | 30.22 | 30.22 | 1 | 25.46 | 6 | kamkkxfxxuwbdslkwifmmcsiusiuosws | 13.200 | Stayed |
| 4 | 568bb38a1afd7c0fc49c77b3789b59a3 | 121335 | 0 | 12400 | 2010-04-08 | 2016-04-08 | 2010-04-08 | 2015-04-12 | 10865.02 | 12400 | 0.0 | 170.74 | 0.110083 | 0.093746 | 40.606701 | No | 1052.37 | 3.18 | 3.18 | 1 | 823.18 | 6 | lxidpiddsbxsbosboudacockeimpuepw | 75.000 | Stayed |
# Obtain all the variables except for id
variables = [column_name for column_name in pco_main_cc_merged.columns if column_name != 'id']

# Obtain all the categorical variables except for id
categorical = [column_name for column_name in variables if pco_main_cc_merged[column_name].dtype == 'object']

# Obtain all the Date Variables
dates = [column_name for column_name in variables if pco_main_cc_merged[column_name].dtype == 'datetime64[ns]']

# Obtain all the numeric columns
numeric = [column_name for column_name in variables
           if column_name not in categorical
           and column_name != 'id'
           and column_name != 'churn'
           and column_name not in dates]
Data Visualization#
The Output Dataset#
# Calculate the zcores of tenure
tenure_zcores = zscore(a=pco_main_cc_merged['num_years_antig'])
# Convert to absolute values
abs_tenure_zscores = np.abs(tenure_zcores)
# Extract Columns of interest
churn_tenure = pco_main_cc_merged[['churn','num_years_antig']]
# Add z-score column
churn_tenure['z_score'] = list(abs_tenure_zscores)
# Remove outliers
churned_tenure_filtered = churn_tenure[churn_tenure['z_score'] < 3]
# Visualize tenure by retained customer and churner
vio = sns.violinplot( y=churned_tenure_filtered["churn"], x=churned_tenure_filtered["num_years_antig"] )
# Settings
vio.set(xlabel='Years', ylabel='')
vio.set_title("Customer Attrition by Tenure")
plt.show()
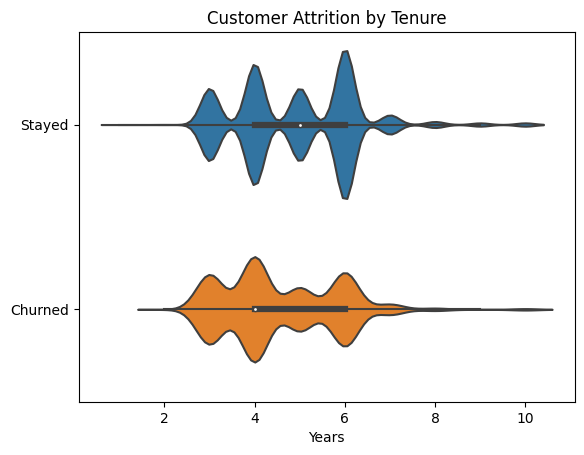
Facts#
The median age of churners is 4 years
Customers are more likely to churn during the 4th year than the 7th year
The median age of retained customers is 5 years
The Main Dataset#
# Most popular electricity campaign in the dataset
ele_nm = pco_main_cc_merged.loc[(pco_main_cc_merged['churn']>='Stayed') & (pco_main_cc_merged['net_margin']>0),['id', 'origin_up','net_margin']]

ele_nm.groupby('origin_up')['net_margin'].count().sort_values(ascending=False)
origin_up
lxidpiddsbxsbosboudacockeimpuepw    6584
kamkkxfxxuwbdslkwifmmcsiusiuosws    4188
ldkssxwpmemidmecebumciepifcamkci    3201
usapbepcfoloekilkwsdiboslwaxobdp       2
ewxeelcelemmiwuafmddpobolfuxioce       1
Name: net_margin, dtype: int64
# Highest netting electricity subscription campaign
print(ele_nm.groupby('origin_up')['net_margin'].agg('sum').sort_values(ascending=False))
origin_up
lxidpiddsbxsbosboudacockeimpuepw    1541159.95
ldkssxwpmemidmecebumciepifcamkci     814230.02
kamkkxfxxuwbdslkwifmmcsiusiuosws     717939.95
usapbepcfoloekilkwsdiboslwaxobdp        250.40
ewxeelcelemmiwuafmddpobolfuxioce         46.22
Name: net_margin, dtype: float64
Facts#
The most popular electricity campaign is
lxidpiddsbxsbosboudacockeimpuepwwhich has brought 6,584 current customers. With a net margin of $1,541,159.95 in 2015.
# Select current customers with positive net margins
top_customers = pco_main_cc_merged.loc[(pco_main_cc_merged['churn']>='Stayed') & (pco_main_cc_merged['net_margin']>0),['id','num_years_antig','net_margin']]

# Top 10 customers by net margin
top_customers.sort_values(by=['net_margin'],ascending=False).head(10)
| id | num_years_antig | net_margin | |
|---|---|---|---|
| 11502 | d00e8a9951b5551d8f02e45f9ed2b0dd | 3 | 10203.50 |
| 6930 | 78bd1c5c0c67f2be6de89b19df5f8861 | 3 | 5625.14 |
| 13259 | 818b8bca0a9d7668252d46b978169325 | 4 | 4346.37 |
| 8378 | a3a739686fbd5ba8b4a21ec835507b6d | 4 | 4305.79 |
| 324 | 89b3406c3ba717f1b788ceeb5af9e8b9 | 3 | 4161.74 |
| 10100 | 93435ecb05910c7b87e0ae9dbedb2882 | 4 | 4148.99 |
| 12028 | 4519e6a8928a015819466fc9de0fa49e | 3 | 4040.60 |
| 6405 | 933527d7a2f669af49075a2380c10ded | 4 | 3744.72 |
| 6850 | 43580ef6cc40fcfd0a9b76eee17a267a | 4 | 3716.78 |
| 13553 | ee98a86efa759681cc59c7d4e0d0312f | 4 | 3407.65 |
These are the most profitable customers for PowerCo in terms of net margin. Notet that most of them are within the likely tenure of attrition.
#!jupyter-nbconvert --to PDFviaHTML BCG.ipynb