Stock Sentiment Analysis from News Headlines#
We have seen how sentiments have driven the markets in recent times. Let’s explore using natural language processing to devise new trading strategies.
This notebook generates investing insights by applying sentiment analysis on financial news headlines from FINVIZ.com. Using a natural language processing technique, we can understand the emotion behind the headlines and predict whether the market feels good or bad about a stock. This enables us to make educated guesses on how certain stocks will perform and trade accordingly.
Why headlines? And why from FINVIZ?
FinViz makes market information accessible and provides a lot of data in visual snapshots.Disclaimer: Investing in the stock market involves risk and can lead to monetary loss. The content in this notebook is purely for educational purposes and should not to be taken as financial advice.
# Import libraries
import pandas as pd
import numpy as np
from datetime import datetime
import matplotlib.pyplot as plt
plt.style.use("fivethirtyeight")
import seaborn as sns
%matplotlib inline
# https://github.com/mariostoev/finviz
import finviz
import nltk
# NLTK VADER for sentiment analysis
from nltk.sentiment.vader import SentimentIntensityAnalyzer
# Tickers of Stocks we want to investigate
TICKER_LIST = ['AMZN', 'GOOG']
finviz-api#
We will be using an unofficial finviz-API made by Mario Stoev to get the news headlines for each stock.
finviz.get_news returns list of sets containing containing:
Datetime
Headline
URL
Source
def get_news(ticker):
    """
    Returns a list of sets containing news headline and url

    :param ticker: stock symbol
    :return: list
    """
    news = finviz.get_news(ticker)
    return news
# Hold the parsed news into a list
parsed_news = []

for ticker in TICKER_LIST:
    try:
        news_array = get_news(ticker)
        for news_set in news_array:
            datetime = datetime.strptime(news_set[0], '%Y-%m-%d %H:%M')
            date = datetime.date()
            time = datetime.time()
            headline = news_set[1]
            parsed_news.append([ticker, date, time, headline])
    except:
        pass
parsed_news[:3]
[]
Sentiment analysis is very sensitive to context#
For example, “This is so addictive!” often means something positive if the context is a video game you are enjoying with your friends, but it very often means something negative when we are talking about opioids.
Financial journalists have their own lingo. Let’s add some new words and sentiment values to our lexicon to make NLTK think like a financial journalist.
nltk.download('vader_lexicon')
[nltk_data] Downloading package vader_lexicon to
[nltk_data]     /home/runner/nltk_data...
True
# New words and values
new_words = {
    'crushes': 10,
    'beats': 5,
    'misses': -5,
    'trouble': -10,
    'falls': -100,
}
# Instantiate the sentiment intensity analyzer with the existing lexicon
vader = SentimentIntensityAnalyzer()
# Update the lexicon
vader.lexicon.update(new_words)
Sentiment Classification#
VADER (Valence Aware Dictionary and sEntiment Reasoner)is a lexicon and rule-based sentiment analysis tool. Let’s use it to quantify how much of positive or negative emotion the text has and also the intensity of emotion.
The tool will generate a compound score, which is the sum of positive, negative & neutral scores which is then normalized between -1(most extreme negative) and +1 (most extreme positive).
# Use these column names
columns = ['ticker', 'date', 'time', 'headline']
# Convert the list of lists into a DataFrame
scored_news = pd.DataFrame(parsed_news, columns=columns)
# Iterate through the headlines and get the polarity scores
scores = [vader.polarity_scores(headline) for headline in scored_news.headline.values]
# Convert the list of dicts into a DataFrame
scores_df = pd.DataFrame(scores)
# Join the DataFrames
scored_news = pd.concat([scored_news, scores_df], axis=1)
# Convert the date column from string to datetime
scored_news['date'] = scored_news.date
# Group by date and ticker columns from scored_news and calculate the mean
mean_c = scored_news.groupby(['date', 'ticker']).mean()
# Unstack the column ticker
mean_c = mean_c.unstack(level=1)
# Get the cross-section of compound in the 'columns' axis
mean_c = mean_c.xs('compound', axis=1)
# Plot a bar chart with pandas
mean_c.plot.bar()
plt.title("Vader compound scores by date for each ticker", fontsize=16)
plt.ylabel("score")
plt.show()
---------------------------------------------------------------------------
KeyError                                  Traceback (most recent call last)
File /opt/hostedtoolcache/Python/3.8.17/x64/lib/python3.8/site-packages/pandas/core/indexes/base.py:3653, in Index.get_loc(self, key)
   3652 try:
-> 3653     return self._engine.get_loc(casted_key)
   3654 except KeyError as err:

File /opt/hostedtoolcache/Python/3.8.17/x64/lib/python3.8/site-packages/pandas/_libs/index.pyx:147, in pandas._libs.index.IndexEngine.get_loc()

File /opt/hostedtoolcache/Python/3.8.17/x64/lib/python3.8/site-packages/pandas/_libs/index.pyx:176, in pandas._libs.index.IndexEngine.get_loc()

File pandas/_libs/hashtable_class_helper.pxi:7080, in pandas._libs.hashtable.PyObjectHashTable.get_item()

File pandas/_libs/hashtable_class_helper.pxi:7088, in pandas._libs.hashtable.PyObjectHashTable.get_item()

KeyError: 'compound'

The above exception was the direct cause of the following exception:

KeyError                                  Traceback (most recent call last)
Cell In[9], line 6
      4 mean_c = mean_c.unstack(level=1)
      5 # Get the cross-section of compound in the 'columns' axis
----> 6 mean_c = mean_c.xs('compound', axis=1)
      7 # Plot a bar chart with pandas
      8 mean_c.plot.bar()

File /opt/hostedtoolcache/Python/3.8.17/x64/lib/python3.8/site-packages/pandas/core/generic.py:4082, in NDFrame.xs(self, key, axis, level, drop_level)
   4080 if axis == 1:
   4081     if drop_level:
-> 4082         return self[key]
   4083     index = self.columns
   4084 else:

File /opt/hostedtoolcache/Python/3.8.17/x64/lib/python3.8/site-packages/pandas/core/frame.py:3760, in DataFrame.__getitem__(self, key)
   3758 if is_single_key:
   3759     if self.columns.nlevels > 1:
-> 3760         return self._getitem_multilevel(key)
   3761     indexer = self.columns.get_loc(key)
   3762     if is_integer(indexer):

File /opt/hostedtoolcache/Python/3.8.17/x64/lib/python3.8/site-packages/pandas/core/frame.py:3815, in DataFrame._getitem_multilevel(self, key)
   3813 def _getitem_multilevel(self, key):
   3814     # self.columns is a MultiIndex
-> 3815     loc = self.columns.get_loc(key)
   3816     if isinstance(loc, (slice, np.ndarray)):
   3817         new_columns = self.columns[loc]

File /opt/hostedtoolcache/Python/3.8.17/x64/lib/python3.8/site-packages/pandas/core/indexes/multi.py:2812, in MultiIndex.get_loc(self, key)
   2809     return mask
   2811 if not isinstance(key, tuple):
-> 2812     loc = self._get_level_indexer(key, level=0)
   2813     return _maybe_to_slice(loc)
   2815 keylen = len(key)

File /opt/hostedtoolcache/Python/3.8.17/x64/lib/python3.8/site-packages/pandas/core/indexes/multi.py:3160, in MultiIndex._get_level_indexer(self, key, level, indexer)
   3157         return slice(i, j, step)
   3159 else:
-> 3160     idx = self._get_loc_single_level_index(level_index, key)
   3162     if level > 0 or self._lexsort_depth == 0:
   3163         # Desired level is not sorted
   3164         if isinstance(idx, slice):
   3165             # test_get_loc_partial_timestamp_multiindex

File /opt/hostedtoolcache/Python/3.8.17/x64/lib/python3.8/site-packages/pandas/core/indexes/multi.py:2752, in MultiIndex._get_loc_single_level_index(self, level_index, key)
   2750     return -1
   2751 else:
-> 2752     return level_index.get_loc(key)

File /opt/hostedtoolcache/Python/3.8.17/x64/lib/python3.8/site-packages/pandas/core/indexes/base.py:3655, in Index.get_loc(self, key)
   3653     return self._engine.get_loc(casted_key)
   3654 except KeyError as err:
-> 3655     raise KeyError(key) from err
   3656 except TypeError:
   3657     # If we have a listlike key, _check_indexing_error will raise
   3658     #  InvalidIndexError. Otherwise we fall through and re-raise
   3659     #  the TypeError.
   3660     self._check_indexing_error(key)

KeyError: 'compound'
Handling duplicates#
Some headlines are the same news piece from different sources, the fact that they are written differently could provide different perspectives on the same story. Plus, when one piece of news is more important, it tends to get more headlines from multiple sources. Let’s get rid of is verbatim copied headlines, as these are very likely coming from the same journalist and are just being “forwarded” around.
# Count the number of headlines in scored_news (store as integer)
num_news_before = scored_news['headline'].count()
# Drop duplicates based on ticker and headline
scored_news_clean = scored_news.drop_duplicates(subset=['ticker', 'headline'])
# Count number of headlines after dropping duplicates
num_news_after = scored_news_clean['headline'].count()
# Print before and after numbers
f"Before we had {num_news_before} headlines, now we have {num_news_after}"
'Before we had 200 headlines, now we have 199'
Sentiment on one single trading day and stock¶#
Now let’s focus on one trading day and one single stock. We will make an informative plot where we will see the smallest grain possible: headline and subscores.
STOCK = TICKER_LIST[0]
DATE = list(scored_news.date)[-1]

# Set the index to ticker and date
single_day = scored_news_clean.set_index(['ticker', 'date'])
# Cross-section the STOCK row
single_day = single_day.loc[STOCK]
# Select the DATE
single_day = single_day.loc[DATE]
# Set the index to time and
single_day = single_day.set_index('time')
# Sort it
single_day = single_day.sort_index()
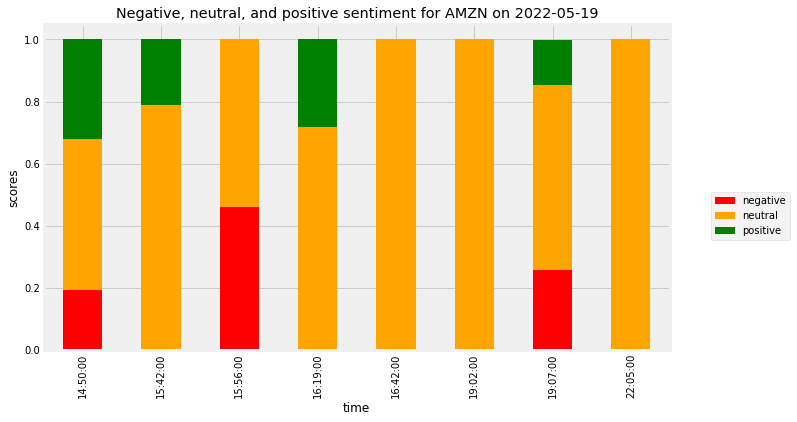
TITLE = f"Negative, neutral, and positive sentiment for {STOCK} on {DATE}"
COLORS = ["red","orange", "green"]
# Drop the columns that aren't useful for the plot
plot_day = single_day.drop(['headline', 'compound'], axis=1)
# Change the column names to 'negative', 'positive', and 'neutral'
plot_day.columns = ['negative', 'neutral', 'positive']
# Plot a stacked bar chart
plot_day.plot.bar(stacked = True,
                  figsize=(10, 6),
                  title = TITLE,
                  color = COLORS).legend(bbox_to_anchor=(1.2, 0.5))
plt.ylabel("scores")
plt.show()